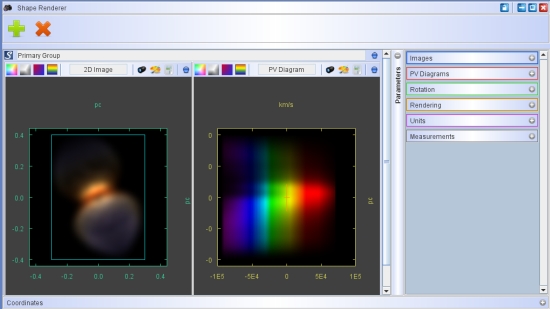
Position-velocity diagrams are obtained from spectroscopic longslit observations with high wavelength resolution that resolve the wavelength shifts due to Doppler-effect. One of the axes, generally horizontal, is wavelength and the other is the position along the slit.
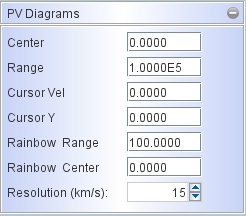
The panel for the PV diagram controls the parameters of the wavelength axis in terms of velocity in km/s. First the Center parameter sets the velocity at the center of the axis, whereas the Range is half the total from the left to the right edge of the axis. The Cursor parameter measure the position of the cursor along the horizontal axis in km/s and the vertical axis in units of the 2D Image. The Rainbow parameters are total Range and Center of the color coding of the velocity. This setting is used in the rainbow image type. Note that these settings are not used when you render with the Transfer Renderer. The transfer renderer uses its own wavelength settings to set the velocity range for the color coding.
Finally, the Resolution parameter sets the FWHM gaussian convolution kernel in velocity, i.e. the spectral resolution in terms of velocity. |